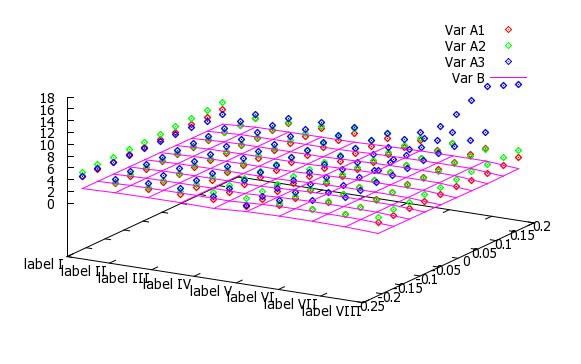
# Stuff in red you gotta change.
# To make the path to the file less messy, you should probably just stick it in the binary folder of your gnuplot directory.
# tested on gnuplot 4.4 for windows
set dgrid3d
set xtics ("label I" 1,"label II" 2, "label III" 3, "label IV" 4, "label V" 5, "label VI" 6, "label VII" 7, "label VIII" 8) # In the same way, you can set ytics and set ztics. Optional.
set xlabel "x label" # Optional.
set ylabel "y label" # Optional.
set zlabel "z label" # Optional.
set xrange [X1:X2] # where X1 < X2. Optional.
set yrange [Y1:Y2] # where Y1 < Y2. Optional.
set zrange [Z1:Z2] # where Z1 < Z2. Optional.
# X is the column where x-coords are
# Y is the column where the y-coords are
# Z1,Z2,Z3 and Z4 are the columns where your variables (those that change with x and y) are.
# the line below is the most important part of this whole script
splot 'file.txt' using X:Y:Z1 with points pt 12 ti "Var A1", \
'file.txt' using X:Y:Z2 with points pt 12 ti "Var A2", \
'file.txt' using X:Y:Z3 with points pt 12 ti "Var A3", \
'file.txt' using X:Y:Z4 with lines ti "Var B" # when it's a 3-d plot, you gotta use splot instead of plot.
